3 ways to analyze user behavior and improve UX
16.02.2024
Your online store can generate more profit. And you don't need to transform your business processes, change your approach to logistics, or spend millions on advertising. We'll explain how to approach audience analysis and hypothesis testing to achieve measurable results: more visitors, more items in shopping carts, more orders, and marginally higher average order value.
Why analyze user behavior
Several years ago, the international brand Marks & Spencer decided to refresh its DNA and conducted a large-scale website redesign. The update cost £150 million. Naturally, all changes were made only after approval from the UX team and top company management.
The website redesign was expected to increase the number of online orders by at least a third. But something went wrong. Users didn't like the site: immediately after the launch of the updated platform, online sales decreased by 8%. The company's monthly revenue dropped by $10 billion.
The reason? Not enough audience analysis. When developing the new version of the site, the brand's specialists relied on their own vision and design trends rather than their users' experience.
To avoid such losses, before implementing any changes to your website or application, you should analyze consumer behavior — collect and study data on customer actions, preferences, and purchases.
Audience analysis helps to:
• determine the most effective customer acquisition channels and optimize marketing costs;
• identify weaknesses in your website and improve user experience;
• predict purchasing behavior and identify best-selling products;
• personalize communication with customers based on the characteristics of the target audience;
• increase conversion to subscribers or buyers;
• catch fraudsters or track competitor attacks.
To achieve these goals, you need to thoroughly study your customers. Here are four main tools for analyzing user behavior.
1. Cohort analysis
A cohort is a group of users united by any common characteristic.
Let's define one cohort as those who made purchases on your website on 11.11 this year. In another cohort — those who made purchases on 11.11 last year.
Let's try to analyze these cohorts separately. For example, we can study what other characteristics are shared among those who bought goods on sale this year. Could it be that most of them are from a similar demographic or came to your site from social networks?
Another way is to analyze two or more cohorts categorized on a similar principle. Like in our example: the people in both groups bought goods on sale, but in different years. By comparing both user segments, we will understand:
• whether audience interest in your sales is growing or declining from year to year;
• whether there's anything in common among people who buy your products or services during sales;
• who buys more during sales — new or loyal users;
• the average bill during sales;
• the percentage of users who make purchases on the site after the sale, and so on.
The conclusions from such research can be unexpected. For example, you might find that sales do not attract a new audience, or that the average bill during a sale is actually lower than usual, or that users attracted to your site by discounts don't buy anything else from you.
In general, you're likely to find problems. Which is great! If there's a problem, there's a solution — which will increase profit. Here you'll be working with engagement, retention, and other important metrics. The conclusions will come naturally.
It might turn out, for example, that for a cohort of users who perform more target actions after coming from social networks, it's better to show targeted advertising, while for those who respond well to emails — to send email newsletters. It's an opportunity to rethink your marketing expenses.
Also, with the help of cohort analysis, you can:
• evaluate whether you're retaining customers and identify factors influencing loyalty;
• identify the most profitable customer groups by analyzing the average bill, purchase frequency and total revenue from different cohorts;
• study seasonal trends and develop a corresponding strategy;
• measure the effectiveness of website changes by assessing user engagement and response;
• personalize offers and promotions — show them only to relevant users;
• set up retargeting based on the behavior of different user types;
• track how the behavior and average bill of cohorts change following a purchase or other target action;
• identify hidden motives that encourage users to buy from you;
• determine factors influencing the decision to purchase: budget, product demand, its popularity, and so on.
2. Optimizing the user path
When analyzing audience behavior, it's essential to not only look at data from analytics services. It's important to also observe how users navigate from one page of the website to another. Are you attracting an audience from all the communication channels you use? Are users staying on the site? Which pages are visited most frequently, and which are ignored? Is it easy for users to navigate from a product card to the catalog or the homepage?To work with this tool, you need to set up events — target actions that a user can perform. For example, clicking a button, installing an application, registering on a website, adding an item to the cart, and so on.
Analyze the paths of users performing target actions and study the analytic heatmaps (such as click, move and scroll maps). Heatmaps let you see if there are design elements on the site that people mistakenly consider clickable.
Also, a heatmap shows which parts of the page are in demand and which are not. A user might spend a lot of time on the site, but focus only on one screen, skipping the rest. If this is a common trend, changes need to be made to the site.
The click map also indicates which calls to action work best. Let's say the conversion rate of a page on your site is lower than expected. Using the heatmap, you can discover that the majority of visitors — for example, 80% — only view the first two screens and simply never reach your call to action. The solution is to duplicate the CTA on the first screens.
This way, you'll understand how to design the site navigation to make it easier for users to make a purchase. On the other hand, analyzing unsuccessful sessions highlights which elements and triggers don't work.
To draw initial conclusions, you only need to analyze the paths of 30–50 users from different cohorts.
See also: Increasing order conversion from a new audience using onsite personalization tools. The Svyaznoy store case
You can study the customer's path through aggregated data. Or you can experience the user journey along with them — by watching a recording of their session.
By viewing such recordings, you will identify:
• the sequence in which the user opens site pages;
• which pages the user spends more time on and why;
• which elements the user quickly skips over and which ones they linger on;
• what problems they encounter in using the site or application;
• what actions they take before leaving.
This helps identify what prevents the user from completing the target action. For example, you have pages on your site that are frequently visited and read at length, but the conversion is low. By using session recordings, you'll understand what users do on the page and why they don't go further. Perhaps they scroll the page up and down, trying to find the information they need, or click a UI element that doesn't lead anywhere.
When viewing recordings, pay attention not only to which pages the user navigates to and which screens they view. Watch the cursor: mouse movements usually correspond to eye movements. That is, people are likely to move the cursor to an element they're looking at.
As a result, you can change elements of the site or application, significantly increasing your conversion rate. The value of the product won't change, but its presentation will improve.
Here's an example from Flocktory's practice. Since 2017, we've been working with the Rendez-Vous brand — an online clothing and footwear store, delivering throughout Russia. We regularly analyze our partner's website and suggest improvements to increase the order conversion and average bill. And it works!
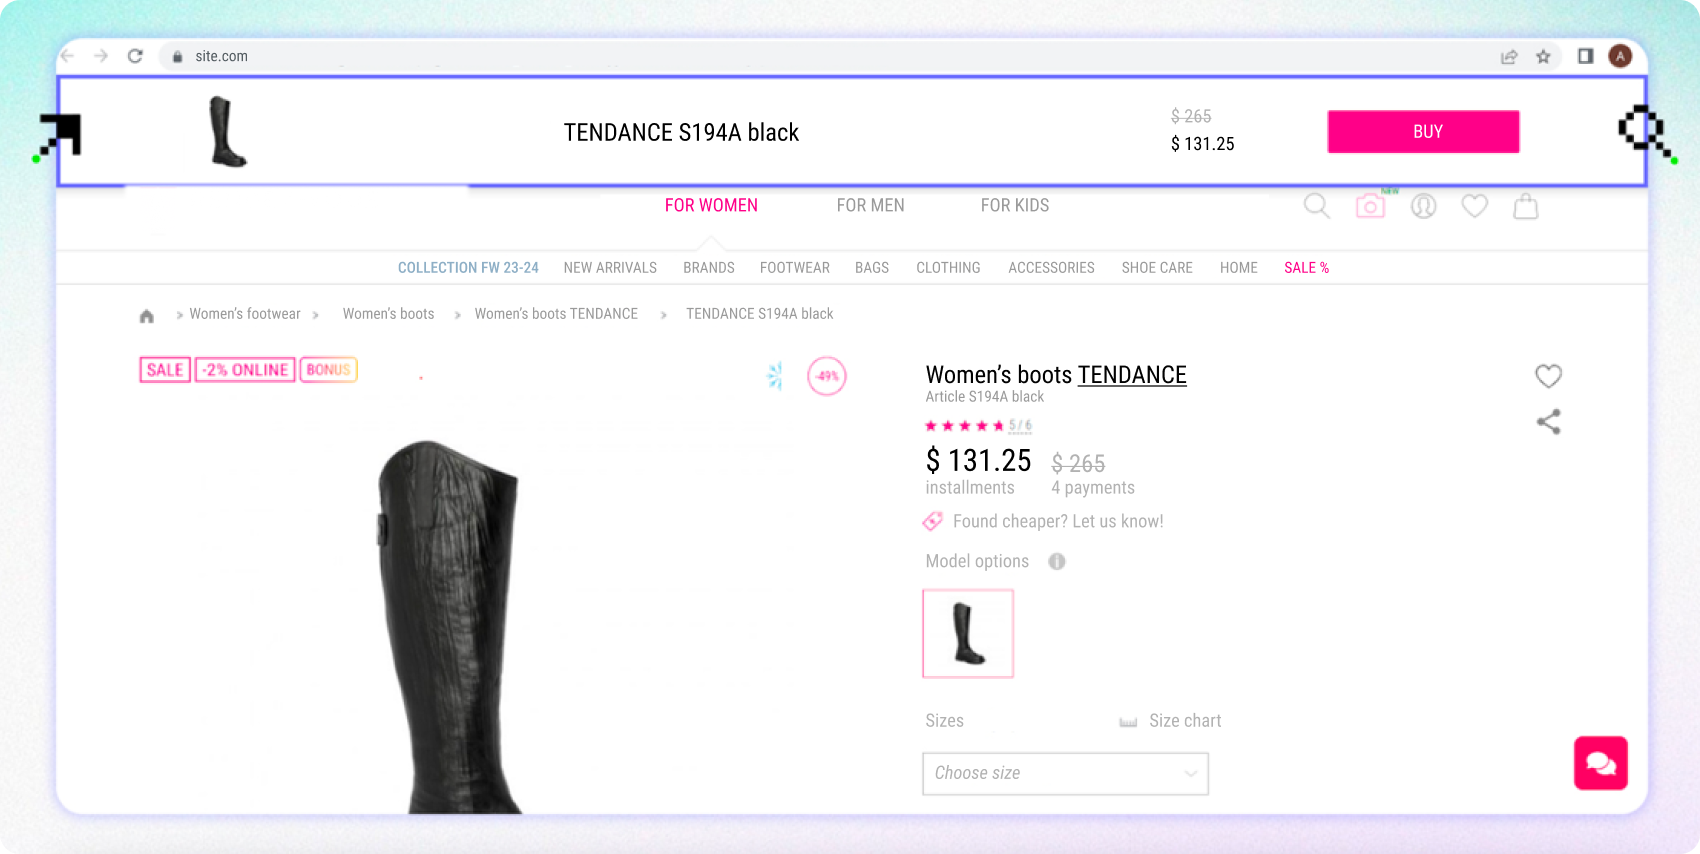
We noticed that users of the Rendez-Vous website often go to the product page and immediately scroll down to learn more about the item. As a result, the buy button disappears from view. To fix this, we added a floating overlay with a prompt to buy the product at the top of the page. It worked: the purchase conversion increased by 4.32%.

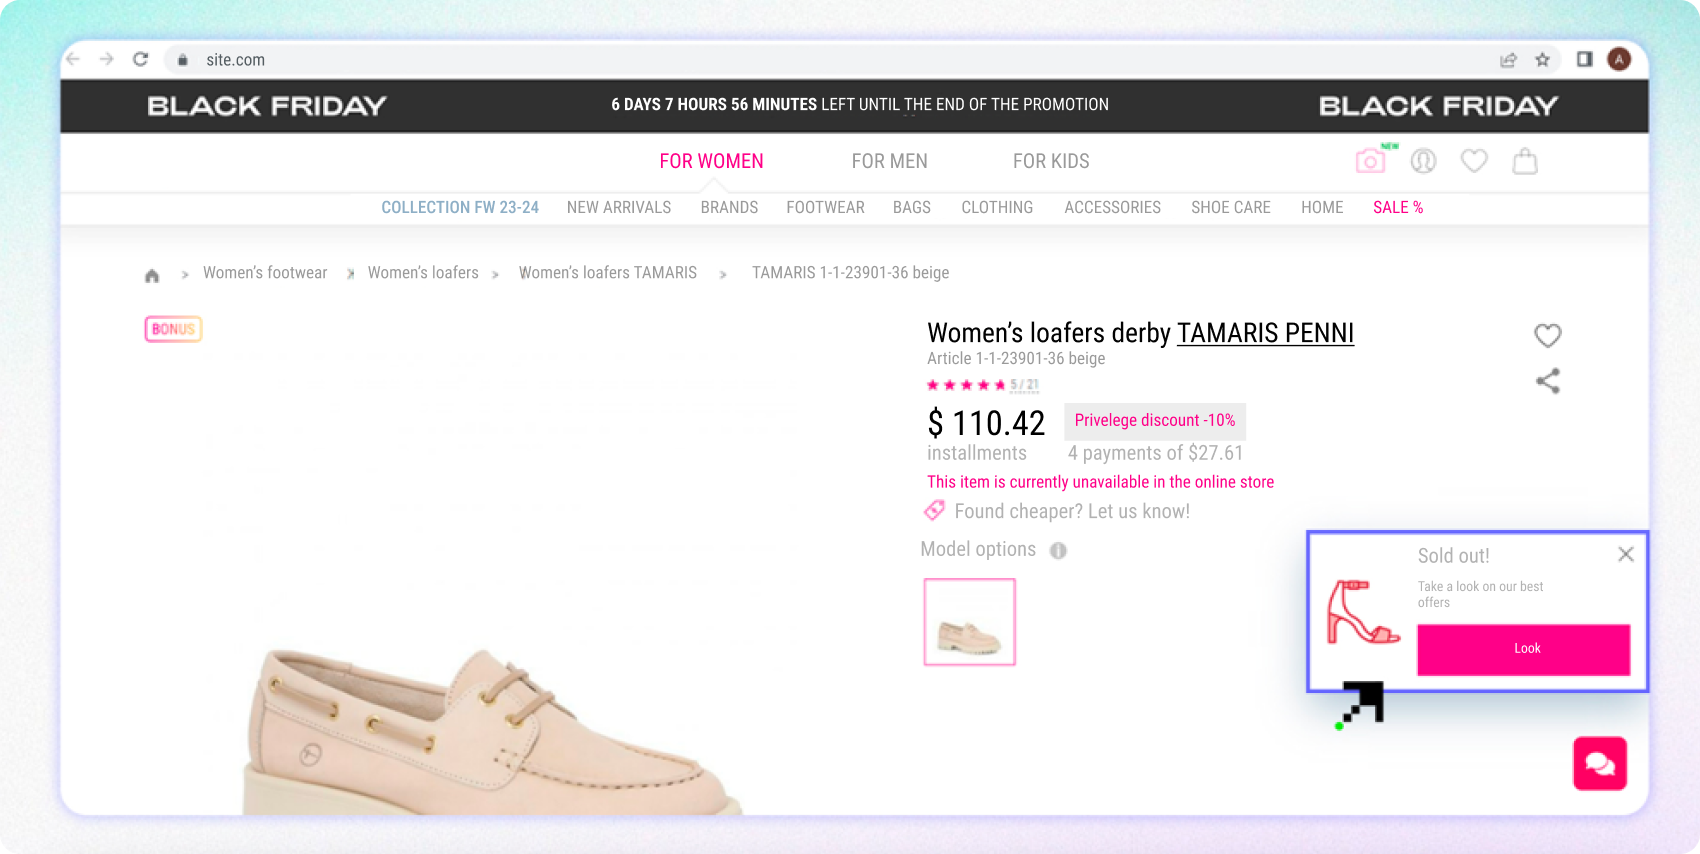
Another example is a navigation prompt. We added it to the pages of all out-of-stock products. Now the user can go from an inactive product to a page with other items, encouraged by a bright banner reading "This product has sold out. Check out our best offers". The click-through rate reached 4.43% of users, whereas before they simply left the site.

3. Conversion funnels
Conversion funnels are a basic tool for marketers and sales professionals. But they're also important in UX. By building such funnels, you can understand whether users are passing through the entire sequence of events you've planned. If not, you'll see it in the funnel.
For example, you assume that from the homepage to the order, users should go through five stages. About 40% of the audience moves through each step. But between two of the steps, the statistics somehow collapse: only a few users pass through.
Let's imagine that an online store has a low order conversion rate. The problem could be literally anywhere:
• you can't access the catalog from the homepage;
• the filters don't work in the catalog;
• there's insufficient information on the product page;
• or maybe the issue is not with the website at all...
By building a user path funnel, you might suddenly notice that incoming traffic to the site is stable, the majority of users are actively exploring the catalog, adding items to their cart. And after that, they abruptly leave the site. So you know exactly which page the problem is on. That's where you can start working.
Example from Flocktory's practice: we helped increase sales for the online clothing store Elyts.ru. Analyzing the company's website, we noticed three peculiarities:
• users move too slowly through the sales funnel: they spend a lot of time in the cart or linger on the site for too long;
• often, buyers exit the sales funnel altogether: they add items to the cart, go there, but then leave the site;
• they leave the site, even though they were exploring the catalog with interest.
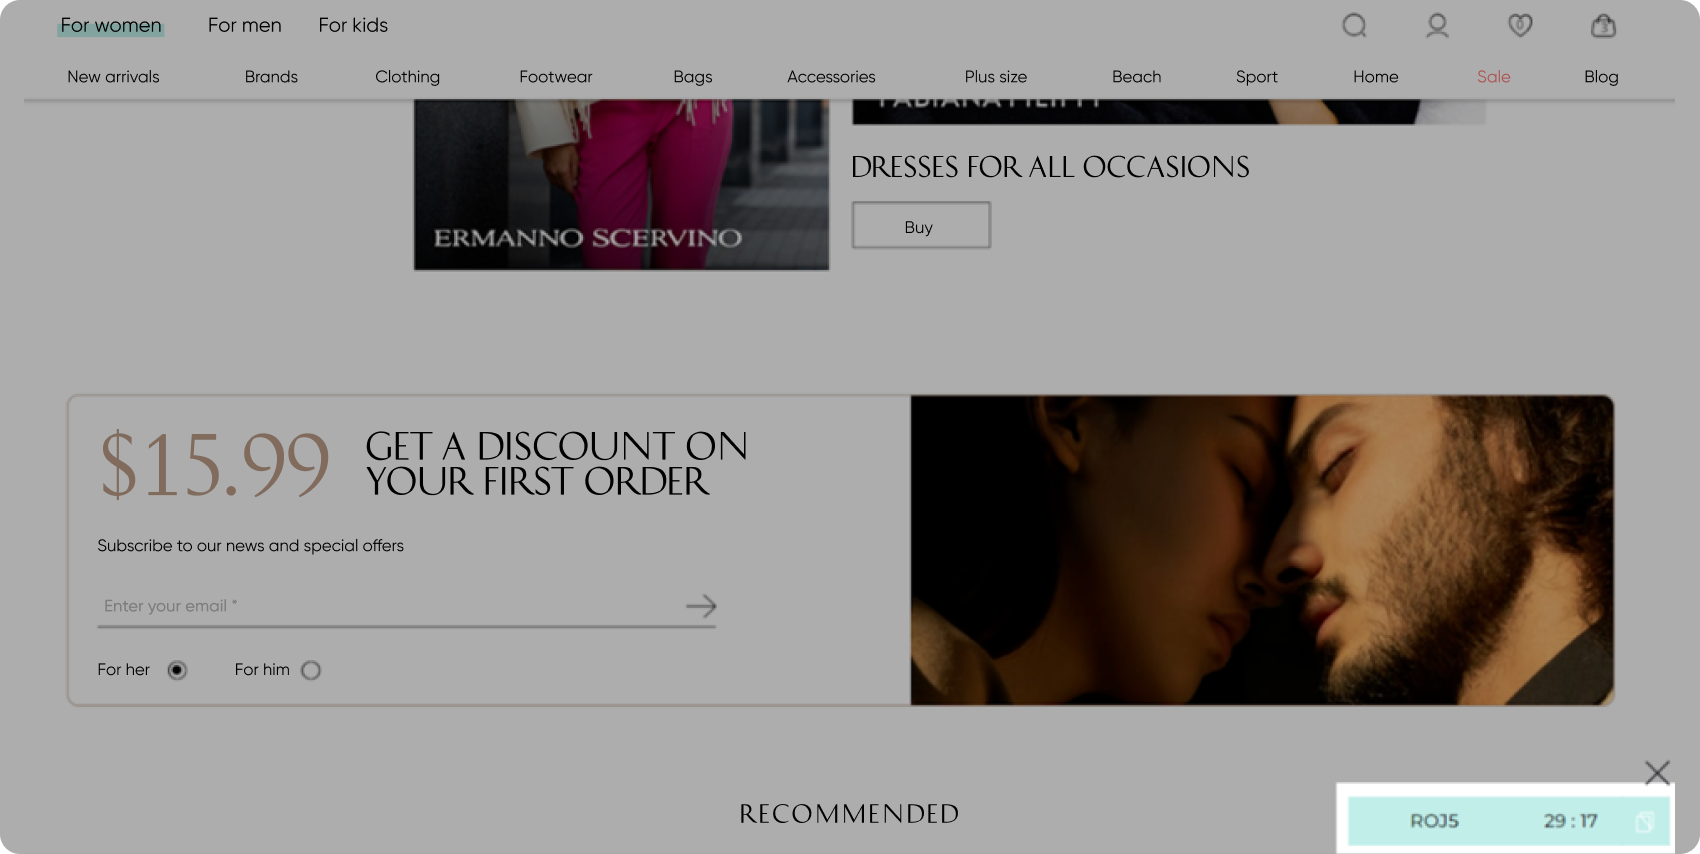
To retain users in the funnel, we started showing them a time-limited discount banner — for 30 minutes.

When the user enters their details to get the promo code, a timer appears on the page. It tells them that there is limited time to make a purchase.

We automated this marketing tool: not all users see the banner, only the audience in target segments.
As a result, the conversion to purchase increased by 10.64%. The average bill for users who saw the widget increased by 32.96%.
You can implement such solutions on your website using Flocktory's onsite personalization tools.
Summary
Analyzing consumer behavior is essential — it helps to swiftly adapt business processes, improve communication, and increase customer loyalty.One tool for studying the audience is cohort analysis. It involves dividing the audience into groups, studying their lifecycle, forecasting conversion for each segment, and then personalizing the marketing strategy.
Navigation paths must also be studied. This way, you make it as easy and fast as possible for users to make a purchase. The most labor-intensive method is to study user session recordings, but it's also the most useful when it comes to UX. You can evaluate what attracts users to the site and what prevents them transitioning from browsing to purchase. And heatmaps and click maps help assess the effectiveness of each page, screen by screen, remove ineffective sections, and add clickable elements.
Conversion funnels are a business tool that is also relevant for UX. Using funnels, you can quickly identify weak points on your website.
Analyze proactively. The ultimate goal of any audit should not be conclusions, but rather changes to your website that will lead to increased sales.
To optimize expenses, improve the effectiveness of communication with customers, and automate marketing, regularly research your customers and look for new ways to reach them. Use Flocktory's personalization solutions. Even if you don't have enough data of your own, we will analyze your audience and set up tools to help you sell more and at higher prices.
More details about each sales enhancement tool are provided on the Products page.


